Downloading the FTSE All Share in R
Introduction
Due to the recent corona crash I thought it would be an interesting time to take a look at the FTSE All Share and have a look at the impact the crash has had on the components prices. I will take you through a few steps which are necessary to download the data, I will then provide a very basic analysis of the data which I may expand upon in the future.
It’s worth noting that this code will not stand the test of time as I will be scraping the data from the London Stock Exchange website which will most likely change in the future, whether that’s the layout of the page or the url, etc. Nevertheless, it will give you an idea of what you can do and will give you a starting point if the code no longer works in the future.
Scraping the tickers
We want to download the price data for the companies that make up the FTSE All Share, but how do we find out which companies make up the index? A simple way is to use the London Stock Exchange website which has the list of companies on there along with their Tickers which we will use for the download. You can have a look at the website here: https://www.londonstockexchange.com/indices/ftse-all-share/constituents/table
You’ll notice that the companies aren’t on one long list ready for us to copy and paste into excel, unfortunately it’s not that easy. Instead, we will make use of the rvest package and scrape each page for the data.
#install.packages("rvest") # if you haven't got it installed already
library(rvest)

# We use the same url mentioned above
url <- "https://www.londonstockexchange.com/indices/ftse-all-share/constituents/table"
# I manually went to the last page to see how many pages there were, you could do it in a more eloquent way but this was the easiest for me
numberofpages <- 31
# We create a blank dataframe ready for the data
FTSEALL <- data.frame("Ticker"=0, "Name"=0)

# Now that we have the website we want to download the data from and the number of pages, we can simply loop through each page to download the contents
for (i in 1:numberofpages) {
  url_i <- paste0(url,"?page=",i)
  webpage <- html_table(html_node(read_html(url_i), xpath='//*[@id="ftse-index-table"]/table'))[,2:3] # see xpath section below
  colnames(webpage) <- c("Ticker", "Name")
  FTSEALL <- rbind(FTSEALL, webpage)
}

FTSEALL <- FTSEALL[-1,]
# Adding a column with the ticker followed by ".L" as this is the name used by yahoo finance which is where quantmod downloads the data from
FTSEALL <- cbind("Ticker"=FTSEALL[,1], "Ticker.L"=paste0(gsub("\\.", "",FTSEALL[,1]),".L"), "Name"=FTSEALL[,2])

# You can save this file as a .rData and use "load" to import it for next time. Example below:
#save(FTSEALL, file="path//FTSEALL.rData")

print(head(FTSEALL))
## Ticker Ticker.L Name
## [1,] "LAM" "LAM.L" "LAMPRELL PLC ORD 5P"
## [2,] "STU" "STU.L" "STUDIO RETAIL GROUP PLC ORD 10P"
## [3,] "SUPP" "SUPP.L" "SCHRODER UK PUBLIC PRIVATE TST PLC ORD 1P"
## [4,] "PHAR" "PHAR.L" "PHAROS ENERGY PLC ORD 5P"
## [5,] "SHI" "SHI.L" "SIG PLC ORD 10P"
## [6,] "POG" "POG.L" "PETROPAVLOVSK PLC ORD 1P"Where to find the xpath?
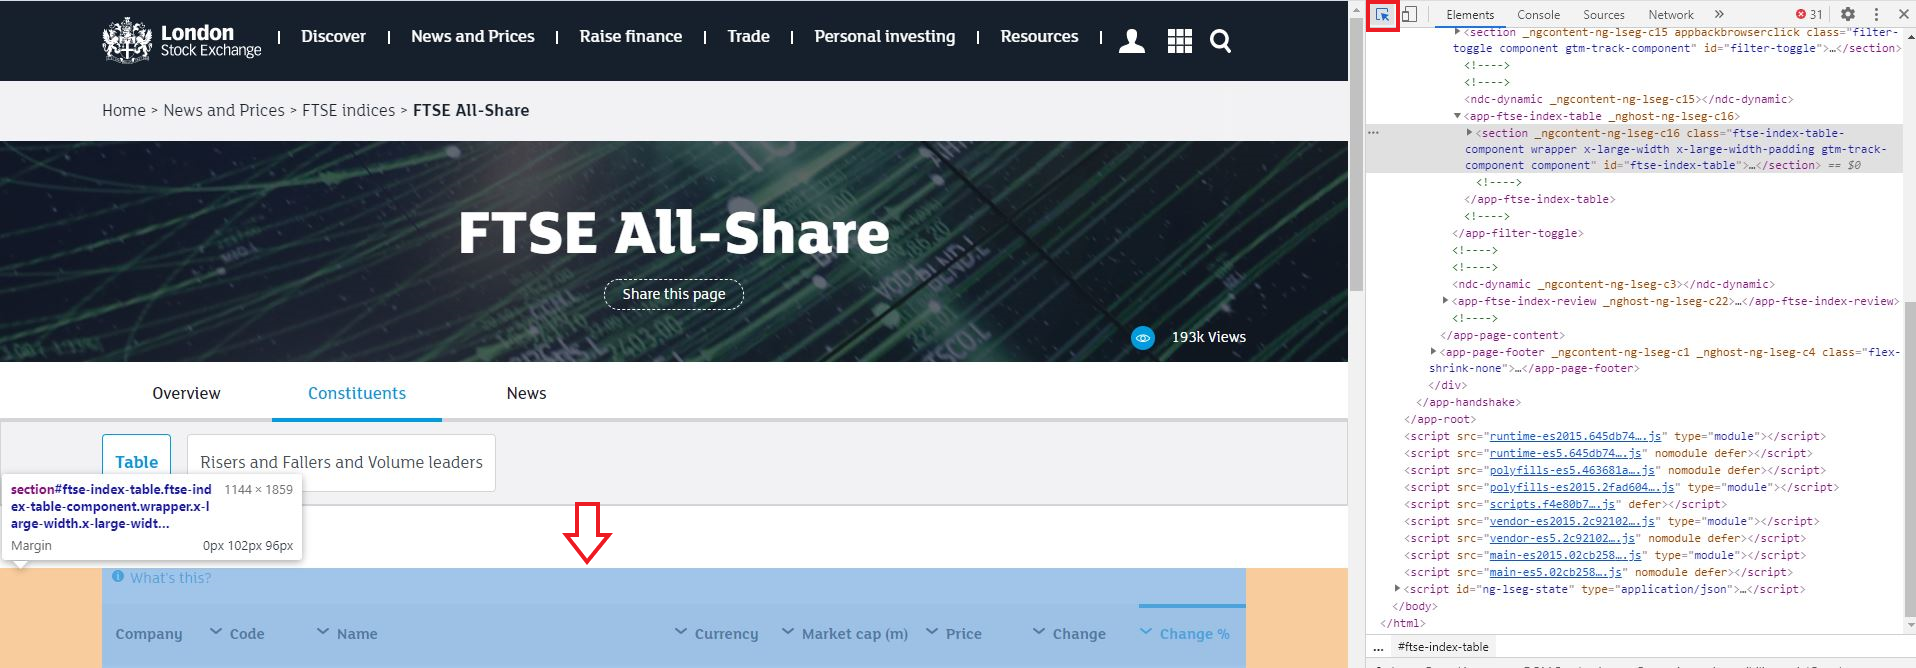
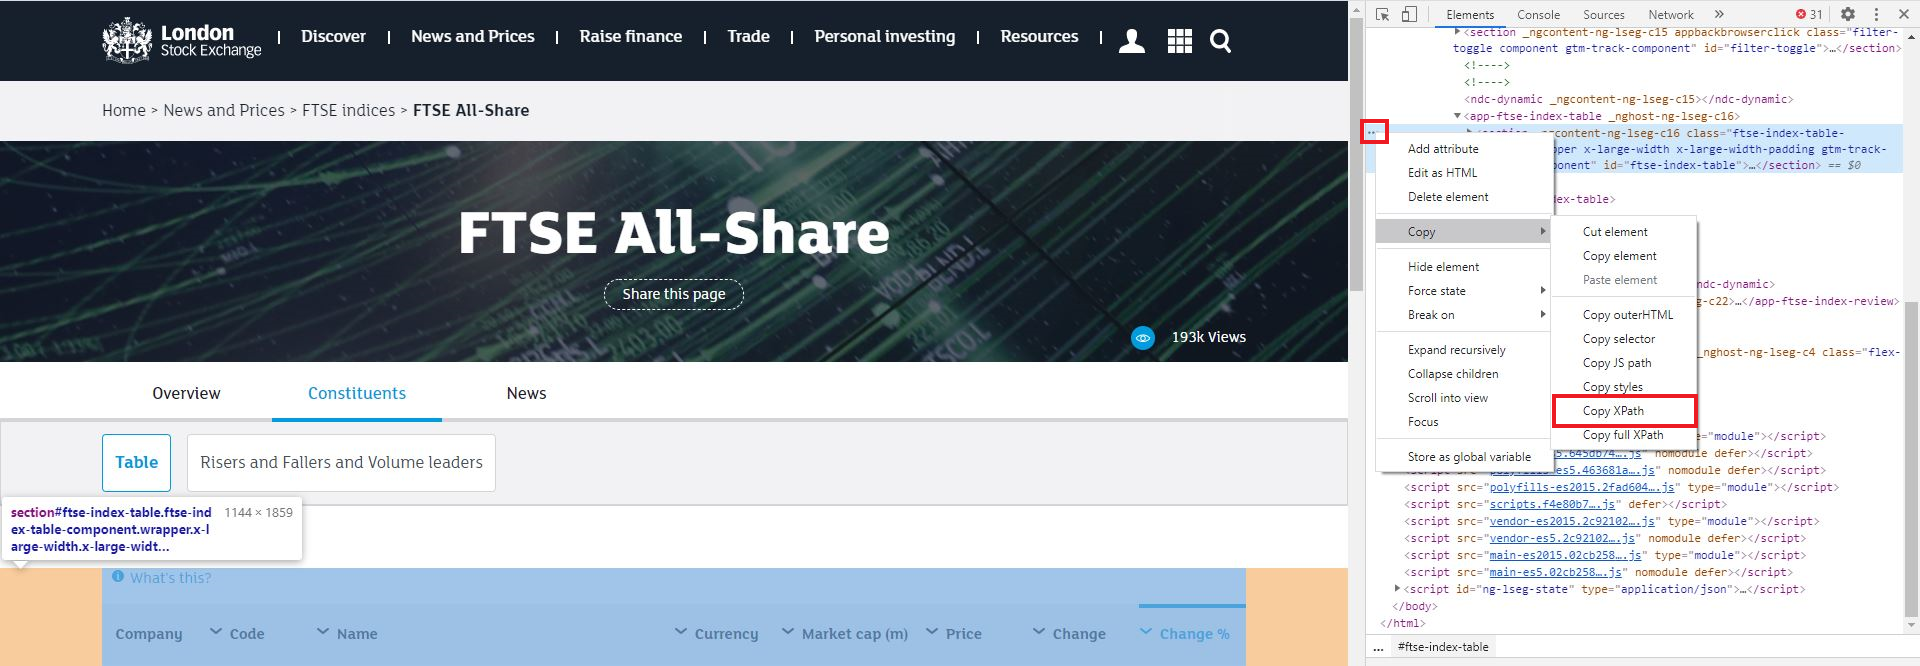
If you are using chrome you can press F12 to open up the Developer tools. You can then use the Select Element tool to click on the table on the webpage, followed by the three dots next to the line, followed by Copy XPath
Step 1
Step 2
Downloading the data
Now that we have our list of tickers we are ready to use quantmod to download them.
#install.packages("quantmod")
library(quantmod)

# you can set any date you like but for this demonstration I am comparing 2019 to 2020 so I only want data from 2019 onwards
startDate <- "2019-01-01"

# you can also amend this as much as you like depending on what you want to analyse
ftseall_analysis <- data.frame("Ticker"=0,
                               "Avg.2019"=0,
                               "Avg.2020"=0,
                               "Jan2020Avg." =0,
                               "Feb2020Avg."=0,
                               "Min2020" =0,
                               "Max2020" =0,
                               "PctChgAvg.2019toNow"=0,
                               "PctChgJantoNow"=0,
                               "PctChgFebtoNow"=0)

for (i in seq_along(FTSEALL[,1])) {

  ## Download Daily Prices
    try({
      data <- getSymbols(Symbols = FTSEALL[i,2],
                        from = startDate,
                        auto.assign = FALSE)
      colnames(data) <- c("open","high","low","close","volume","adjusted")
      data <- na.omit(data)
      data <- as.xts(data)

      # calculate the values we want to compare
      avg_2019 <- mean(data["/2019-12-31","close"])
      avg_2020 <- mean(data["2020", "close"])
      avg_jan <- mean(data["2020-01", "close"])
      avg_feb <- mean(data["2020-02", "close"])
      min_2020 <- min(data["2020", "close"])
      max_2020 <- max(data["2020", "close"])
      change_2019_now <- ((coredata(last(data[,"close"]))-avg_2019)/avg_2019)[1]
      change_jan_now <- ((coredata(last(data[,"close"]))-avg_jan)/avg_jan)[1]
      change_feb_now <- ((coredata(last(data[,"close"]))-avg_feb)/avg_feb)[1]

      # combine the values and add them to the dataframe
      ftseall_analysis <- rbind.data.frame(ftseall_analysis,
                              cbind.data.frame("Ticker"=FTSEALL[i,2],
                                               "Avg.2019"=avg_2019,
                                               "Avg.2020"=avg_2020,
                                               "Jan2020Avg." =avg_jan,
                                               "Feb2020Avg."=avg_feb,
                                               "Min2020" =min_2020,
                                               "Max2020" =max_2020,
                                               "PctChgAvg.2019toNow"=change_2019_now*100,
                                               "PctChgJantoNow"=change_jan_now*100,
                                               "PctChgFebtoNow"=change_feb_now*100))
    })
}

# There are a couple of companies which don't have data for 2019 so I have removed them by finding the "NaN" entries and excluding them from the results
ftseall_analysis <- ftseall_analysis[-which(ftseall_analysis[,"Jan2020Avg."]=="NaN"),]
ftseall_analysis <- ftseall_analysis[-1,]
row.names(ftseall_analysis) <- 1:nrow(ftseall_analysis)print(head(ftseall_analysis))## Ticker Avg.2019 Avg.2020 Jan2020Avg. Feb2020Avg. Min2020 Max2020 PctChgAvg.2019toNow PctChgJantoNow PctChgFebtoNow
## 1 LAM.L 52.36 22.44 35.23 32.53 7.02 40.00 -59.32 -39.55 -34.52
## 2 STU.L 200.06 196.60 233.11 235.22 141.00 247.00 6.47 -8.63 -9.45
## 3 SUPP.L 59.61 27.19 33.81 30.18 20.35 36.90 -51.35 -14.22 -3.91
## 4 PHAR.L 65.03 26.45 51.67 36.59 10.40 57.80 -75.49 -69.15 -56.44
## 5 SHI.L 126.63 51.82 100.52 85.03 17.51 125.20 -70.91 -63.35 -56.68
## 6 POG.L 9.23 20.67 14.20 18.08 12.12 30.75 233.23 116.62 70.07Conclusion
This has been a simple demonstration on how to scrape the FTSE All Share tickers and download the prices using the quantmod package. You can also scrape some fundamental data from the LSE website too, so I may create a post about that in the future, as it is also very easy to do.
Scott Clark
ACCA Qualified Finance Professional
My interests include R programming, finance and photography.